
Mixing & Mass Transfer
Find what limits the process.
Stirring harder costs power and does not always help. We mapped mixing time and mass transfer across the whole operating window of an aerated production vessel, which showed what limits the process at each operating point and where more agitation brings nothing.
Challenge
Is the process oxygen-limited or mixing-limited?
When an aerated fermentation hits a limit, the usual fixes are to stir faster or gas more. Both cost money and can harm the culture. Whether they help at all depends on what limits the process at that operating point. It can be oxygen transfer, measured as kLa (the oxygen transfer coefficient), or the time the vessel needs to blend.
At production scale you can rarely measure both across the full operating window. A simulation can.
Approach
All Relevant Quantities from One Simulation
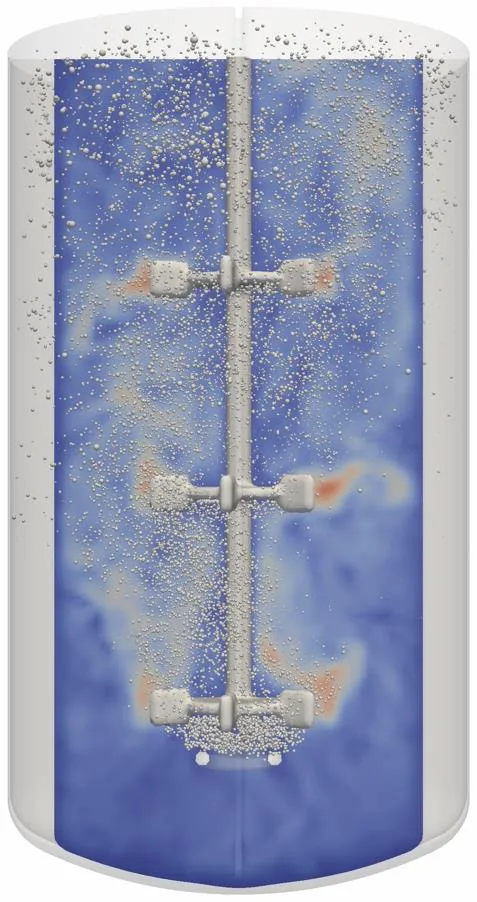
Our platform computes the gassed flow field with a GPU-accelerated lattice-Boltzmann method. It follows every bubble on its own path as a Lagrangian particle, including when bubbles break up or merge. One transient simulation delivers all of the following.
- Mixing time (tm,95, the time to reach 95 % homogeneity), tracked with a simulated tracer
- Local and overall kLa, computed from the bubbles with the eddy-cell model
- Gas holdup, bubble size distribution and the flooding point, where the impeller stops dispersing gas
- Power input, shear rates and dead zones
The method was developed and validated on industrial reactors, using local gas holdup measurements in a 150 L vessel with three impellers and simulations of a 40 m³ production reactor (Witz et al., Chemical Engineering Science 2016 (opens in a new tab)).
Results
Operating Points Selected from Mapped Mixing Time and kLa
The map showed the customer, for each operating point, whether oxygen transfer or mixing was the limit. Oxygen transfer could then be raised where it was short, and extra agitation skipped where mixing was already good enough, which spares the culture and saves stirring power.
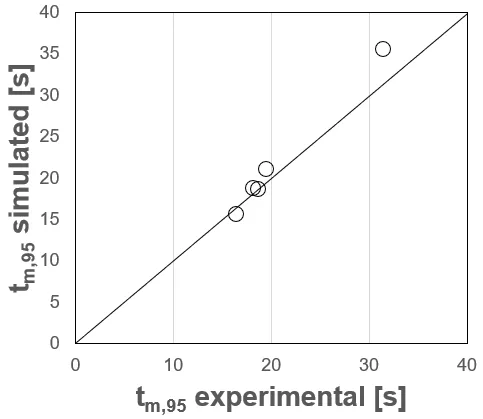
- tm,95Simulated mixing times match experiments in a 30 L vessel across 100–300 rpm
- kLaResolved locally, everywhere in the vessel
Facing a similar question? Let's talk.
Tell us about your reactor and your bottleneck. We will show you what simulation can quantify before you change anything in steel.