
From Shake Flask to Stirred Tank
Hydrodynamic Matching Across Scales
Cells that grow well in a shake flask can change shape or lose viability in the stirred tank, because the flow around them is different. CFD (computational fluid dynamics) shows what the cells experience in the flask, so the reactor can give them the same conditions.
01 · Challenge
Unknown Hydromechanical Stress in Early Process Development
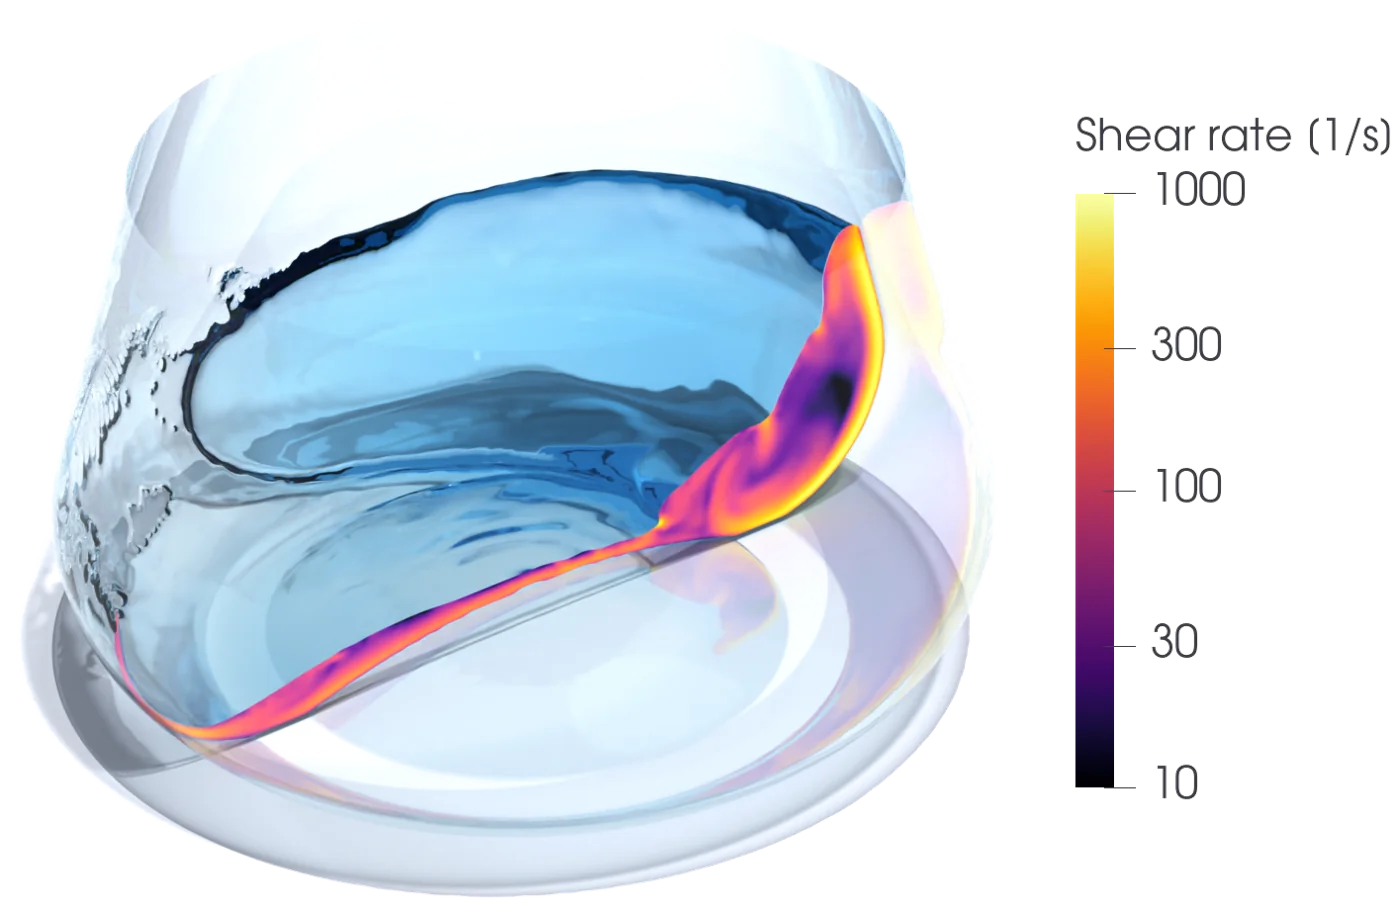
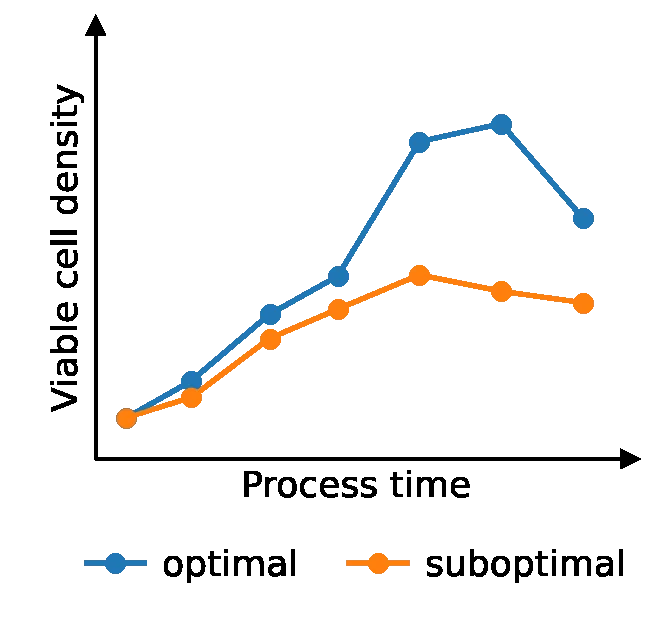
Most processes start in shake flasks, and nobody measures or controls the hydromechanical stress (shear and turbulent forces from the moving liquid) that the cells feel there. Shear-sensitive cultures such as Streptomyces spp. or NK (natural killer) cells notice the difference. If the stirred tank stresses them more or less than the flask did, their morphology or viable cell density (living cells per volume) changes.
A simulation shows where in the liquid the stress peaks and how it changes over time, which one average value for the whole flask cannot tell you.
02 · Approach
Flask Simulation, Validation and Stress Matching at Scale
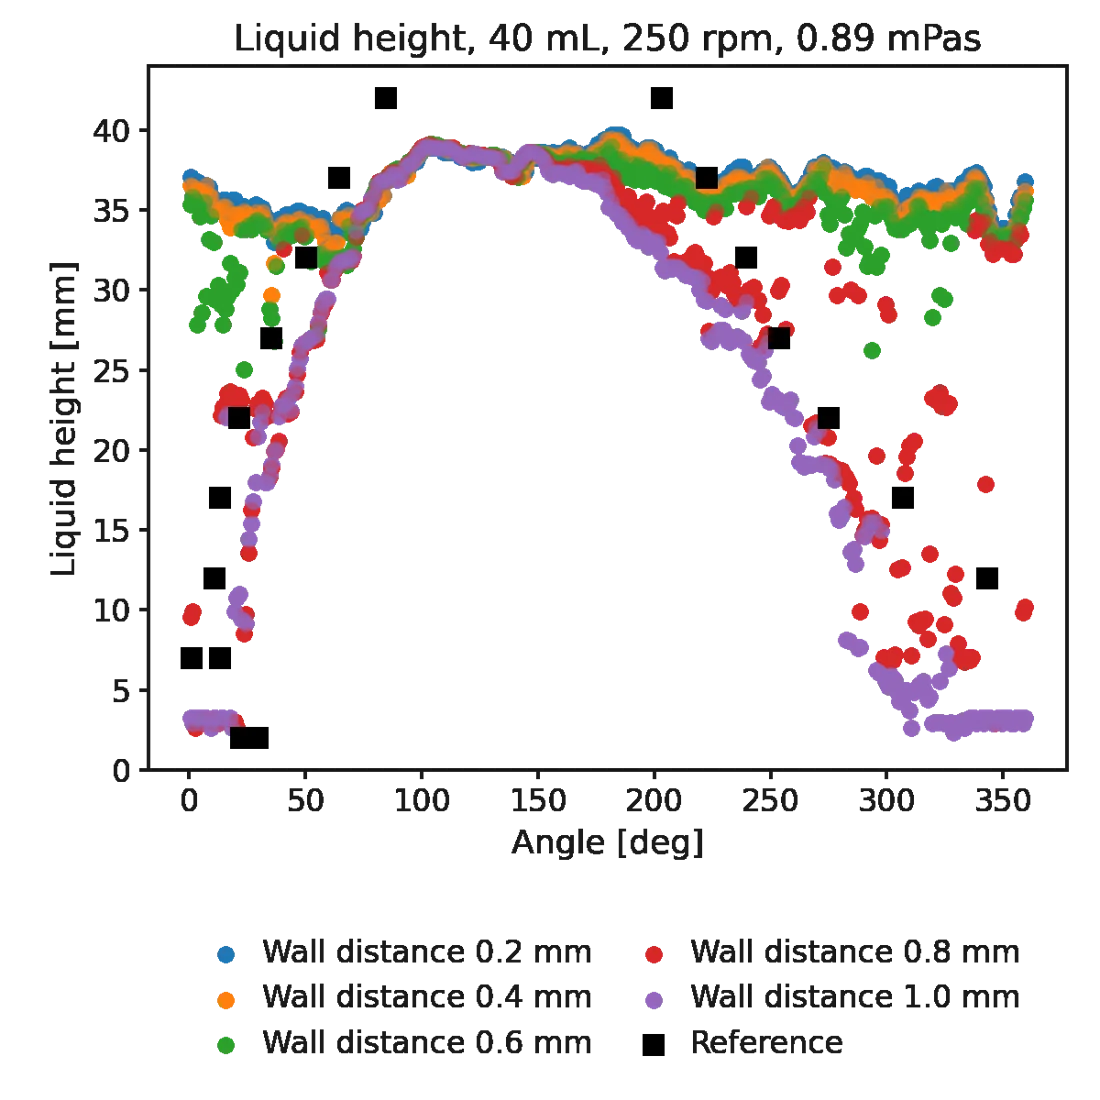
The simulation computes the shape of the rotating liquid in the flask from the flow itself, without assuming it. We only use its predictions after checking it against two published data sets, the line where the liquid touches the flask wall (Azizan & Büchs 2017) and the power input at different viscosities (Büchs et al. 1999). The model reproduces both without tuning, so we can trust its local flow data when we carry it over to the reactor.
Validation

03 · Scale-Up
Four Steps from Flask to Reactor
The flask tells you how the cells should grow, and the flask simulation tells you what flow they grew in. In-silico scale-up (scale-up carried out in simulation) then searches for reactor operating points that recreate that flow, and lab runs in the stirred tank check the result. Few teams scale up this way yet, so the projects deliberately tested several scale-up criteria against each other.
We used this workflow with TU Wien and TU Graz to scale up NK-cell expansion.
In Collaboration with


-
01
Lab
Flask Experiments
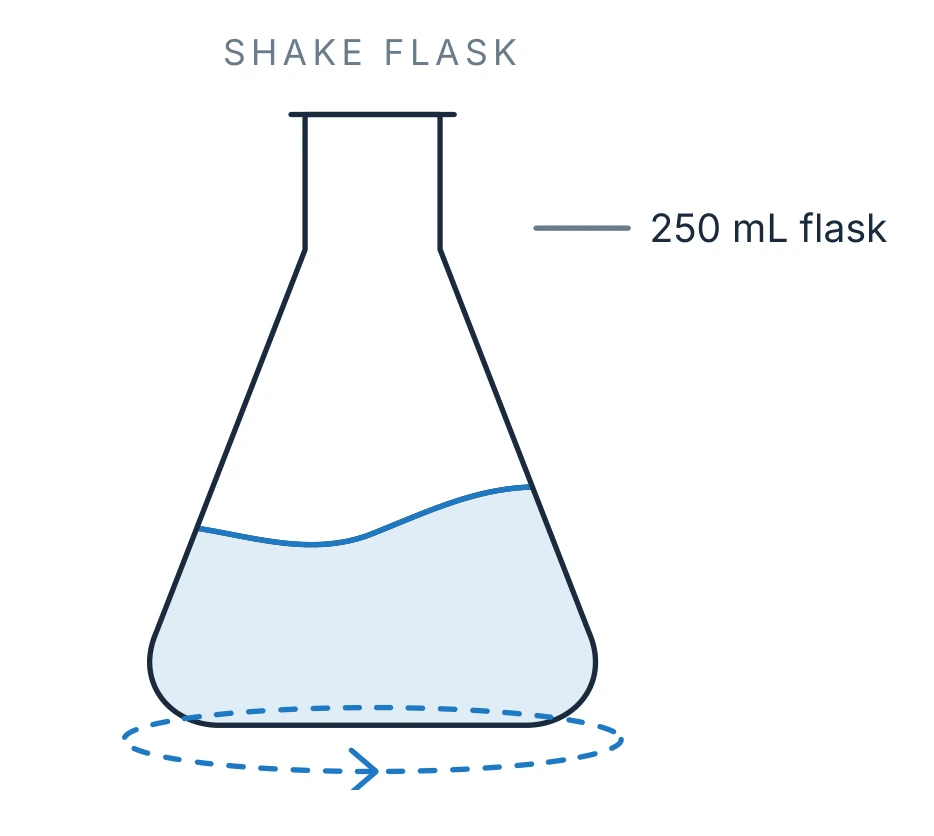
Cells grown in the shake flask set the target values for viable cell density and cytotoxicity.
-
02
CFD
Flask Simulation
Free-surface CFD shows where shear and energy dissipation peak in the flask and how they spread through the liquid.

-
03
CFD
In-Silico Scale-Up
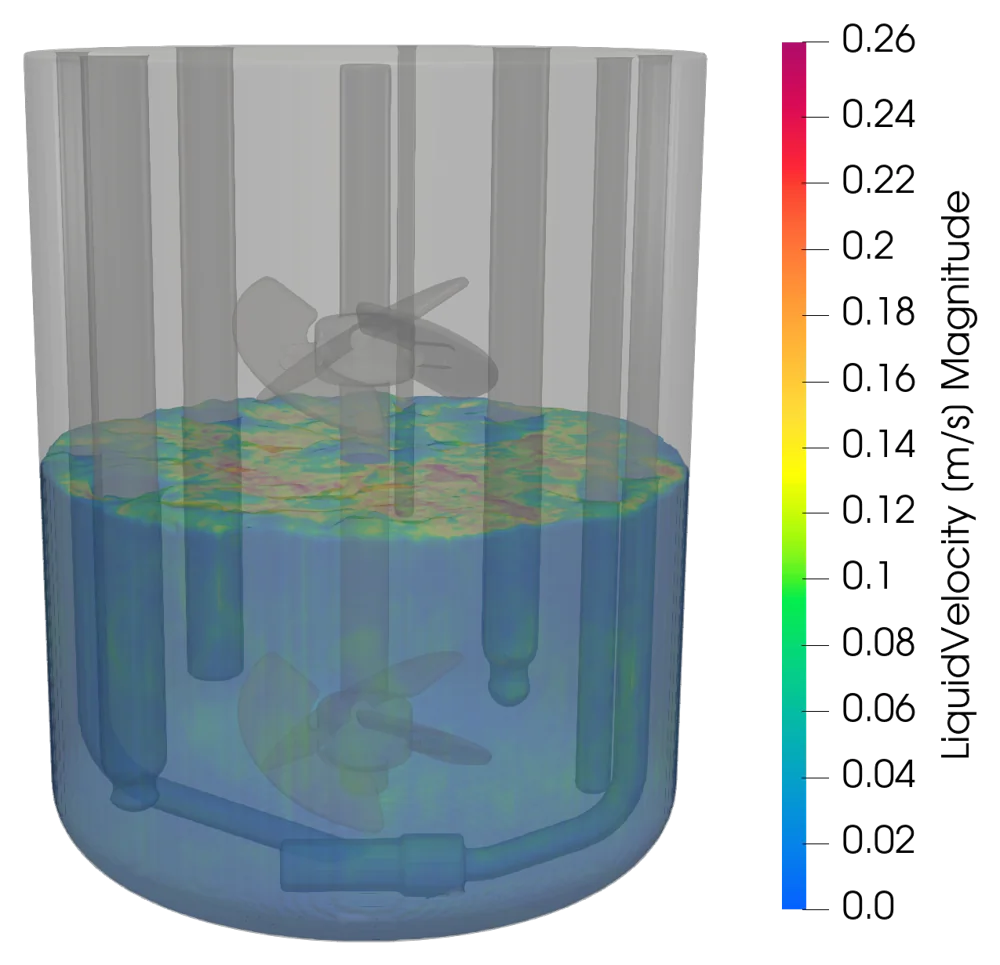
The reactor simulation runs at different operating points until one matches the flow the cells saw in the flask.
-
04
Lab
Confirmation Runs
Cultivations in the stirred tank at that operating point check whether viable cell density and cytotoxicity match the flask.
04 · Publication
Reactor Simulation Based on a Characterized Shake Flask
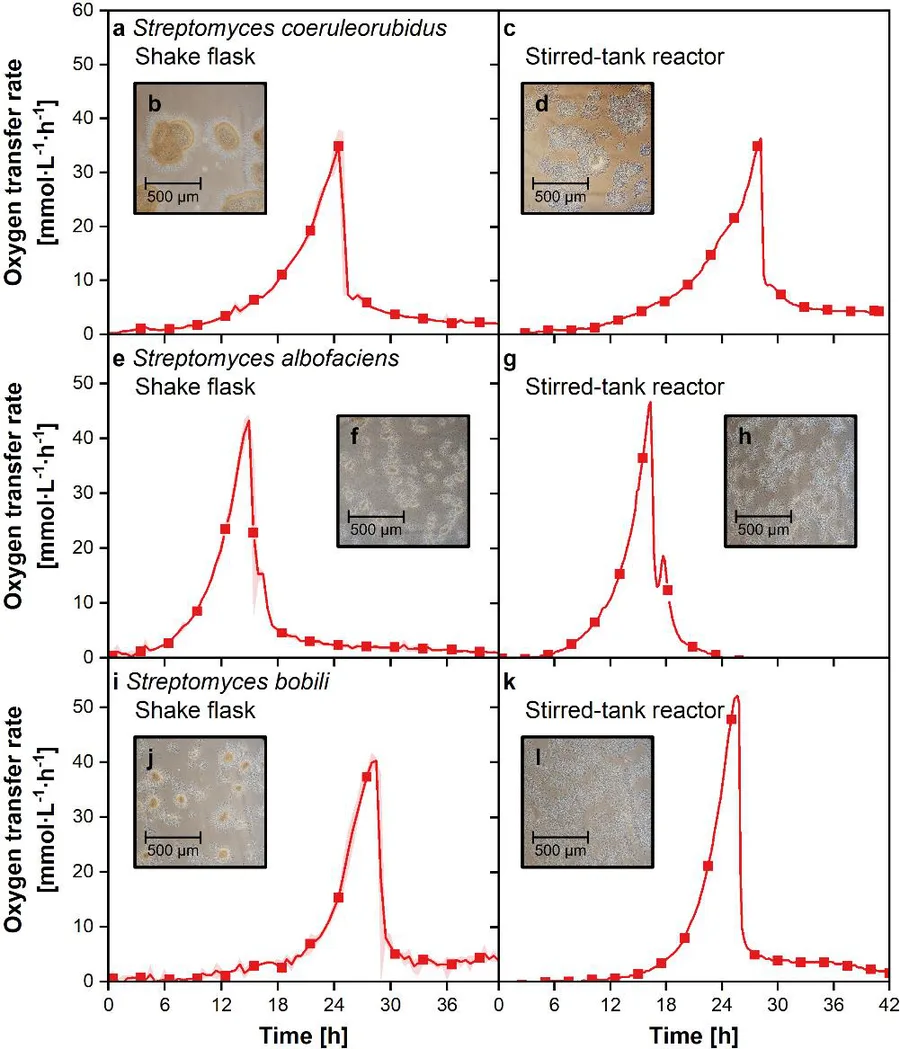
With RWTH Aachen (AVT), we scaled three Streptomyces species from shake flask to stirred tank. The stress in this shake flask was already known, so it went straight into the reactor simulation and no flask simulation was needed. When the reactor ran at the same average energy dissipation rate (how fast turbulent energy turns into heat, a measure of hydromechanical stress), the morphology changed. Cells that grew as compact pellets in the flask grew as loose mycelium in the stirred tank. The maximum value was no help either, because in our CFD runs from 100 to 1000 rpm it jumped around too much. Its 95th percentile, ε95%, is far more stable, so we used it to pick the operating point. There, all three species kept a morphology close to the flask, and oxygen transfer followed the same curve as in the flask for the first 12 to 15 h.
The study appeared as Brauneck et al., AIChE Journal 2026 (opens in a new tab), which proposes ε95% as a new scale-up parameter for filamentous cultivations.
In Collaboration with

Facing a similar question? Let's talk.
Tell us about your reactor and your bottleneck. We will show you what simulation can quantify before you change anything in steel.